10-Year Yield Hits 5% as Curve Steepens Slightly Amid Mixed Momentum
MarketsFN Data Team
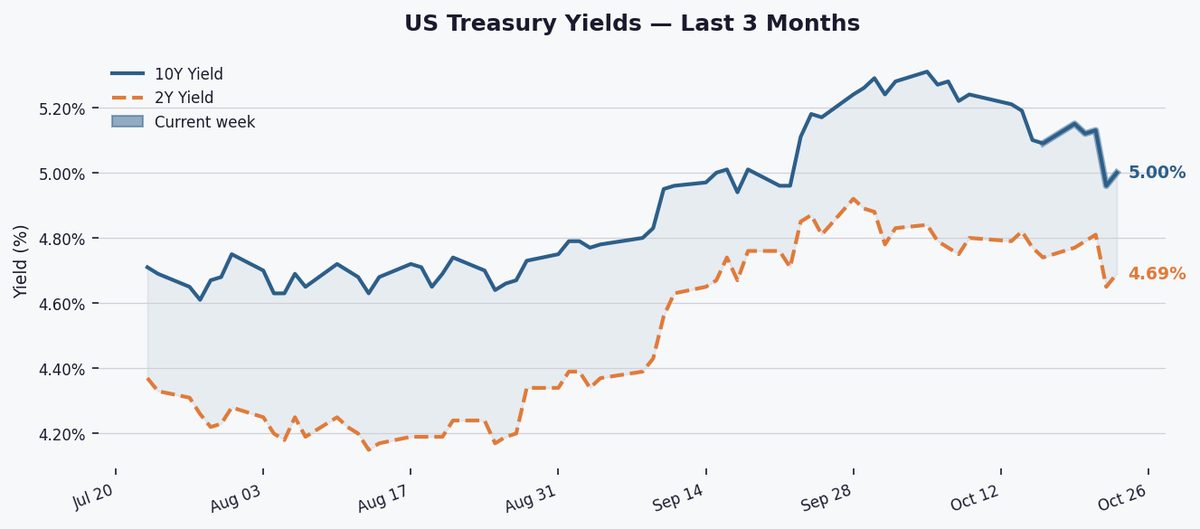
Rising Treasury yields reflect persistent inflation concerns even as the S&P 500 climbs, signaling divergent expectations between equity and bond markets. The 10-year's flirtation with 5% suggests investors remain wary of Fed policy amid mixed economic signals, while the modest steepening hints at lingering growth doubts despite recent momentum.
The 10-year Treasury yield rose 4bps to 5.000% Tuesday, extending recent volatility while the 2Y-10Y spread widened to +32bps, maintaining a positive curve signal.
The 10-year yield remains 9bps below last week's level but sits 97bps above its 1-year average, hovering near the middle of its 52-week range (3.97%-5.31%). Despite Tuesday's rise, it's still below the 3-month average of 4.903%, reflecting persistent uncertainty in rate expectations.
The 2Y-10Y spread widened to +32bps, up 6bps from last week but well below its 52-week high of +74bps. The persistently positive curve suggests markets see limited near-term recession risk, though the spread's 2026 range (+20bps to +74bps) indicates ongoing growth uncertainty.

Markets await Q3 GDP data Thursday and September PCE inflation Friday for Fed policy clues. Any surprises could test whether 10Y yields hold 5%, with Fed speakers also in focus after recent dovish leanings.
Key Statistics at a Glance
| Edition | Mid-Week Update |
| Date | Tuesday, October 27, 2026 |
| 10Y Yield | 5.00% |
| 10Y Day-on-day | ▼ 4.0 bps |
| 10Y Week-on-week | ▼ 9.0 bps |
| 10Y YTD change | +81.0 bps |
| 10Y 3-month avg | 4.90% |
| 10Y 1-year avg | 4.44% |
| 10Y 52-week high | 5.31% |
| 10Y 52-week low | 3.97% |
| 2Y Yield | 4.69% |
| 2Y–10Y Spread | +0.320% (+32.0 bps) |
| Spread WoW | ▼ 6.0 bps |
| Spread 52-week high | +0.740% |
| Spread 52-week low | +0.200% |
| Curve signal | Positive |